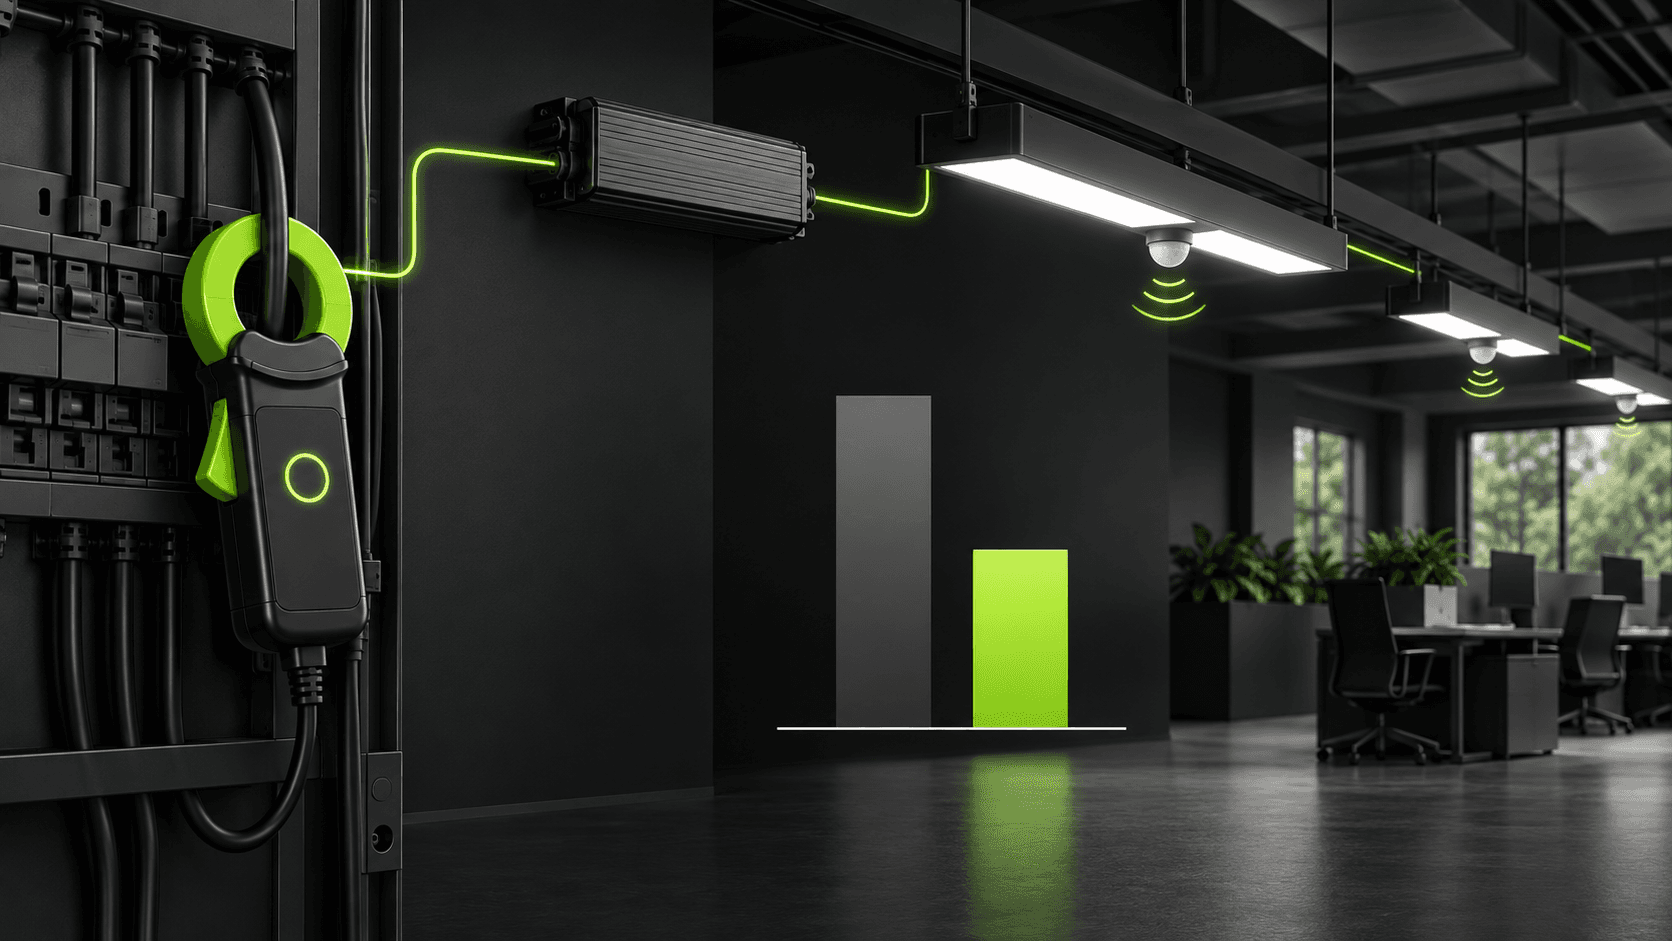
A large savings percentage is useful only when a project team can identify its baseline, time window, and measurement boundary. Recent connected-lighting work makes the case for collecting better information at the point of use, but engineering value appears only when the information survives the path from device to decision to actual luminaire behavior. That path needs a defined installation context, a named control owner, and a record of what each component is known to do.
This article uses the current product record as a practical starting point. MC079D RC3 lists standby power below 0.3W and configurable standby levels. KL70C-PDiiV1 lists standby power below 0.5W, 2–100% dimming, and a maximum 87% efficiency figure at 230Vac. These figures inform a budget but do not replace whole-system input measurements. The selection method is deliberately conservative: use published parameters to constrain a design, and use documented integration information plus site testing to validate every behavior that is not explicitly stated.
The engineering method is discussed against real models. Diagrammed examples and conceptual connections name their operating boundaries. Confirm product parameters against the current model, variant, and applicable technical documentation.
Start with a measurement boundary, not a percentage
A large savings percentage is useful only when a project team can identify its baseline, time window, and measurement boundary. A project should begin with the operational question rather than a feature name. Identify the people, equipment, light level, response time, and maintenance outcome that the space needs. This makes it possible to distinguish a useful requirement from a marketing label.
A dimming percentage is not necessarily the same as an input-power percentage, and individual device standby values must not be added again if the meter has already captured the complete circuit. Treat this distinction as a design input. It prevents a system diagram from assigning responsibilities to a product before its actual interface, documented function, and configuration route have been verified.
Keep the evidence attached to the decision that it supports. Record the model and variant, physical location, configuration revision, wiring or network condition, date, observer, measured result, and any exception. When a result changes after a setting, installation, or firmware change, preserve both records. This gives the next engineer a way to distinguish a changed requirement from a changed system response.
Use state time instead of one average dimming value
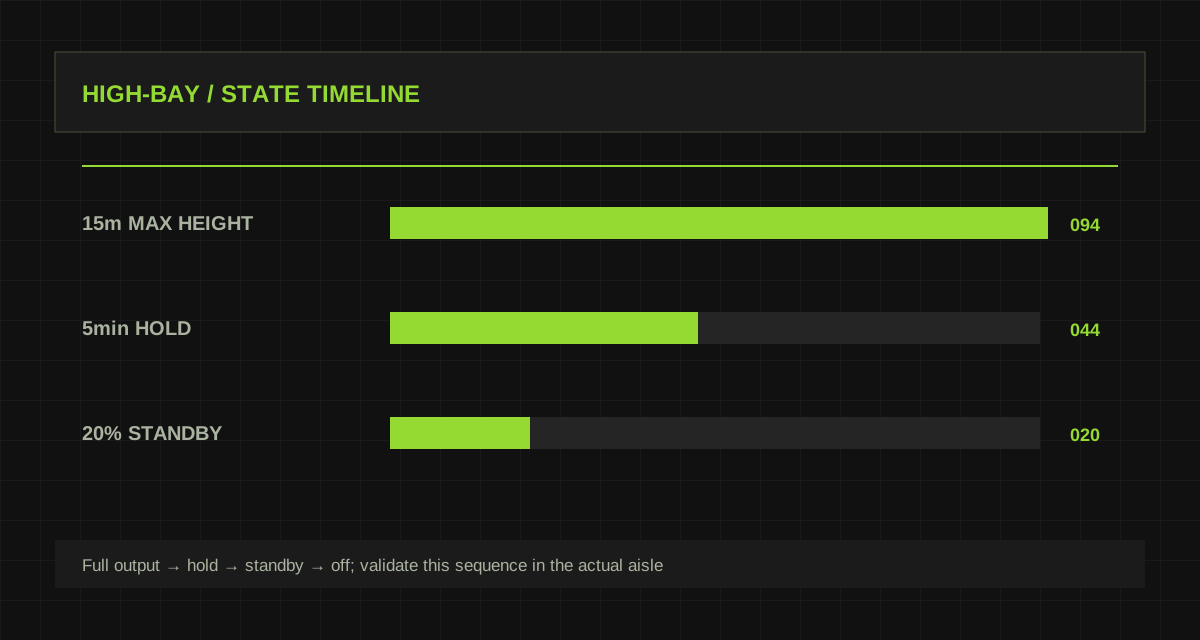
MC079D RC3 lists standby power below 0.3W and configurable standby levels. KL70C-PDiiV1 lists standby power below 0.5W, 2–100% dimming, and a maximum 87% efficiency figure at 230Vac. These figures inform a budget but do not replace whole-system input measurements. Read each field together with its condition and unit. A current setting, voltage window, maximum mounting height, standby figure, or IP rating has meaning only in the context of the specific product variant and installed assembly.
Create a short “known / confirm / test” table for the project. Published data belongs in known; exact firmware, wiring, protocol, mounting construction, load, and operating condition belong in confirm or test until evidence moves them into the known column.
Keep the evidence attached to the decision that it supports. Record the model and variant, physical location, configuration revision, wiring or network condition, date, observer, measured result, and any exception. When a result changes after a setting, installation, or firmware change, preserve both records. This gives the next engineer a way to distinguish a changed requirement from a changed system response.
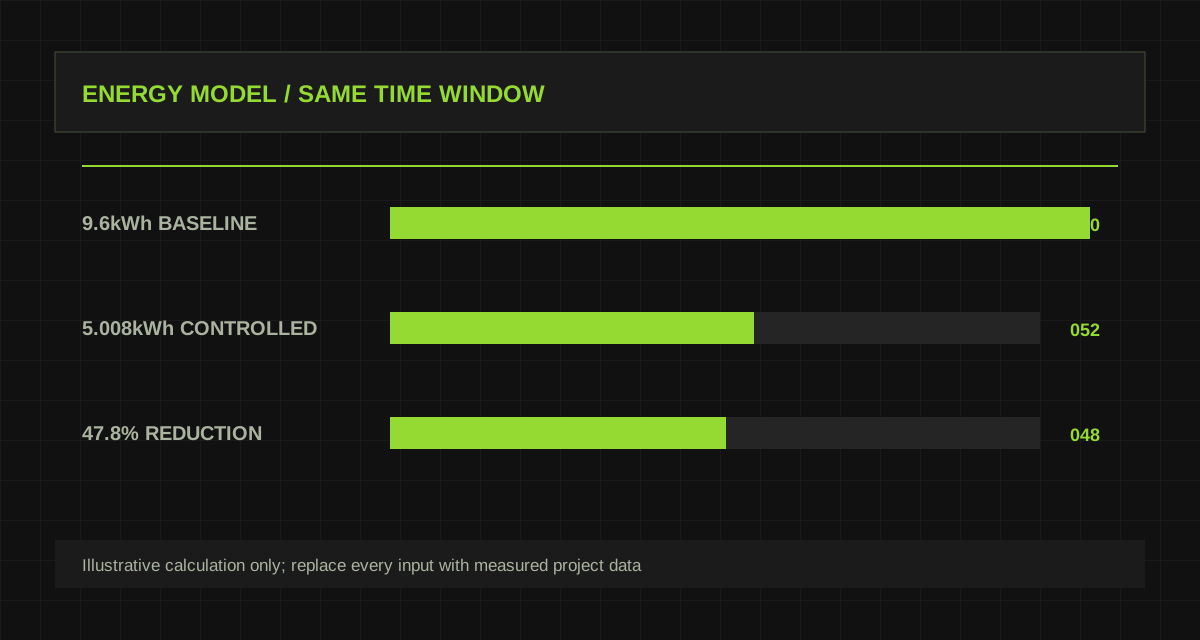
Do not equate dimming percentage and power percentage
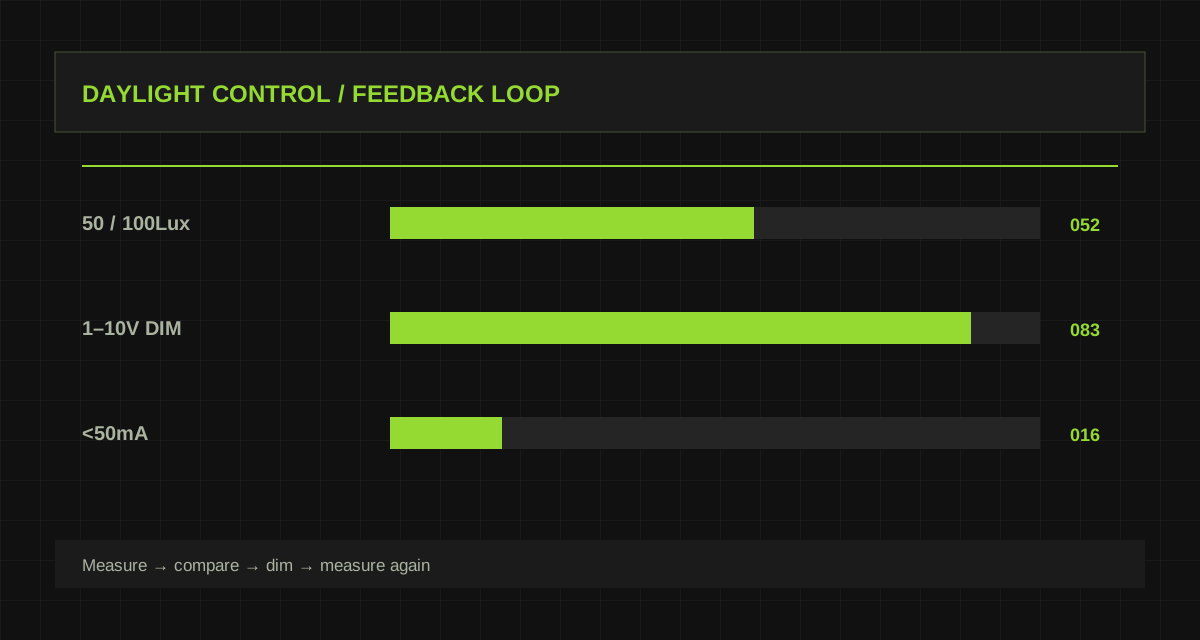
Write the baseline, time window, control states, and metering boundary before calculation. Then measure full, dimmed, standby, and off behavior on the actual luminaire, driver, sensor, and auxiliary devices included in the project. Keep the first test deliberately small, with documented versions and a stable environment. A controlled pilot produces evidence that can be understood later; a full installation with several simultaneous changes often produces symptoms without a clear cause.
For every input, write the expected result and the owner of the decision. A sensor can report an observation, a controller can apply policy, and a driver or other actuator can execute a result. When two devices can issue conflicting decisions, define priority before the system reaches site.
Keep the evidence attached to the decision that it supports. Record the model and variant, physical location, configuration revision, wiring or network condition, date, observer, measured result, and any exception. When a result changes after a setting, installation, or firmware change, preserve both records. This gives the next engineer a way to distinguish a changed requirement from a changed system response.
Include standby without double-counting it
Compare matched operating periods, document missing data and changes in operating hours, and record illumination, complaints, manual overrides, and unexpected off events alongside the energy results. Run the scenarios in a fixed order and keep raw observations where possible: measured light, input power, device status, event time, configuration revision, and room condition. One convincing demonstration is not an acceptance method; repeatability is.
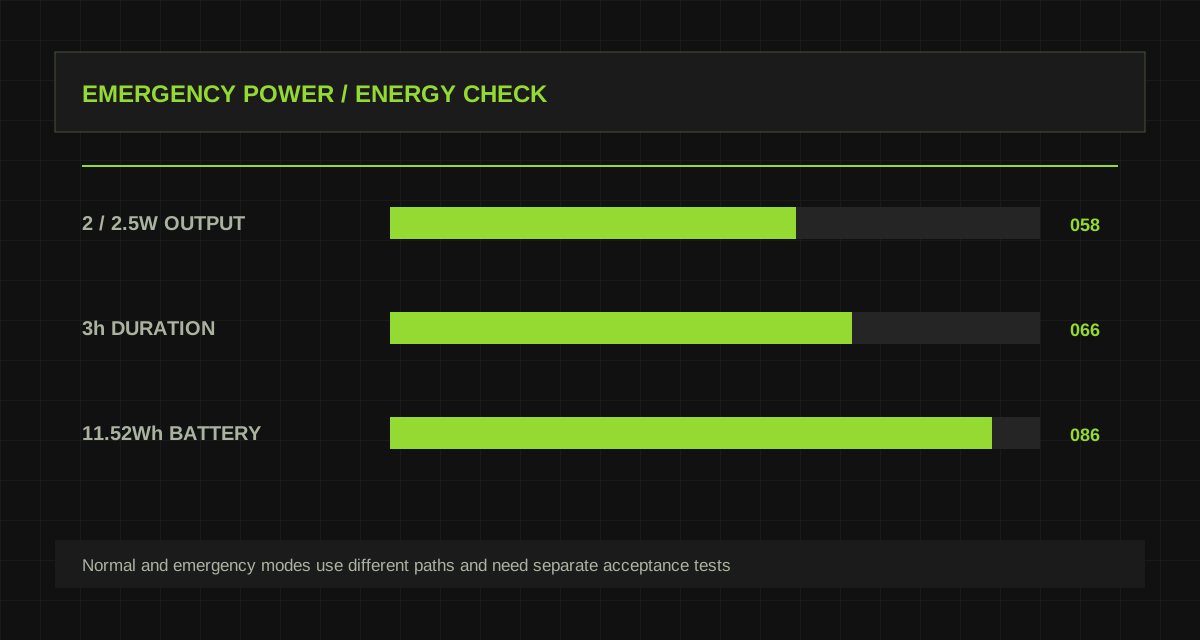
Fault behavior deserves the same attention as normal behavior. The system should state whether information is current, stale, missing, or invalid, then apply the approved fallback. A communications failure must not silently masquerade as a normal vacant or healthy state.
Keep the evidence attached to the decision that it supports. Record the model and variant, physical location, configuration revision, wiring or network condition, date, observer, measured result, and any exception. When a result changes after a setting, installation, or firmware change, preserve both records. This gives the next engineer a way to distinguish a changed requirement from a changed system response.
Use telemetry carefully and keep a meter as a reference
Use results to refine the zone, operating policy, and maintenance plan rather than to force a single universal setting. Installation changes, furnished spaces, varying daylight, user behavior, and electrical conditions often matter more than a nominal figure quoted without its test boundary.
Where an external system is involved, preserve an explicit interface contract: device and firmware identification, signal or data meaning, addressing, timeout rule, safety boundary, and recovery behavior. That contract is what keeps a working pilot from becoming an opaque deployment.
Keep the evidence attached to the decision that it supports. Record the model and variant, physical location, configuration revision, wiring or network condition, date, observer, measured result, and any exception. When a result changes after a setting, installation, or firmware change, preserve both records. This gives the next engineer a way to distinguish a changed requirement from a changed system response.
Evaluate comfort and energy in the same acceptance record
A credible result includes the equations, assumptions, input measurements, data-quality notes, and human-use outcome so a customer can recalculate the conclusion when conditions change. Handover should include drawings, configuration exports, parameter selections, tested scenarios, the original site conditions, and a short sequence a technician can repeat after replacement or refurbishment.
The purpose of the document is not to claim that technology eliminates engineering judgement. It is to make that judgement visible, testable, and easier to carry forward as the project, the building, and the installed product set evolve.
Keep the evidence attached to the decision that it supports. Record the model and variant, physical location, configuration revision, wiring or network condition, date, observer, measured result, and any exception. When a result changes after a setting, installation, or firmware change, preserve both records. This gives the next engineer a way to distinguish a changed requirement from a changed system response.
Products and key parameters
These fields come directly from the current product library. Open the product page to confirm complete parameters and the applicable product record.
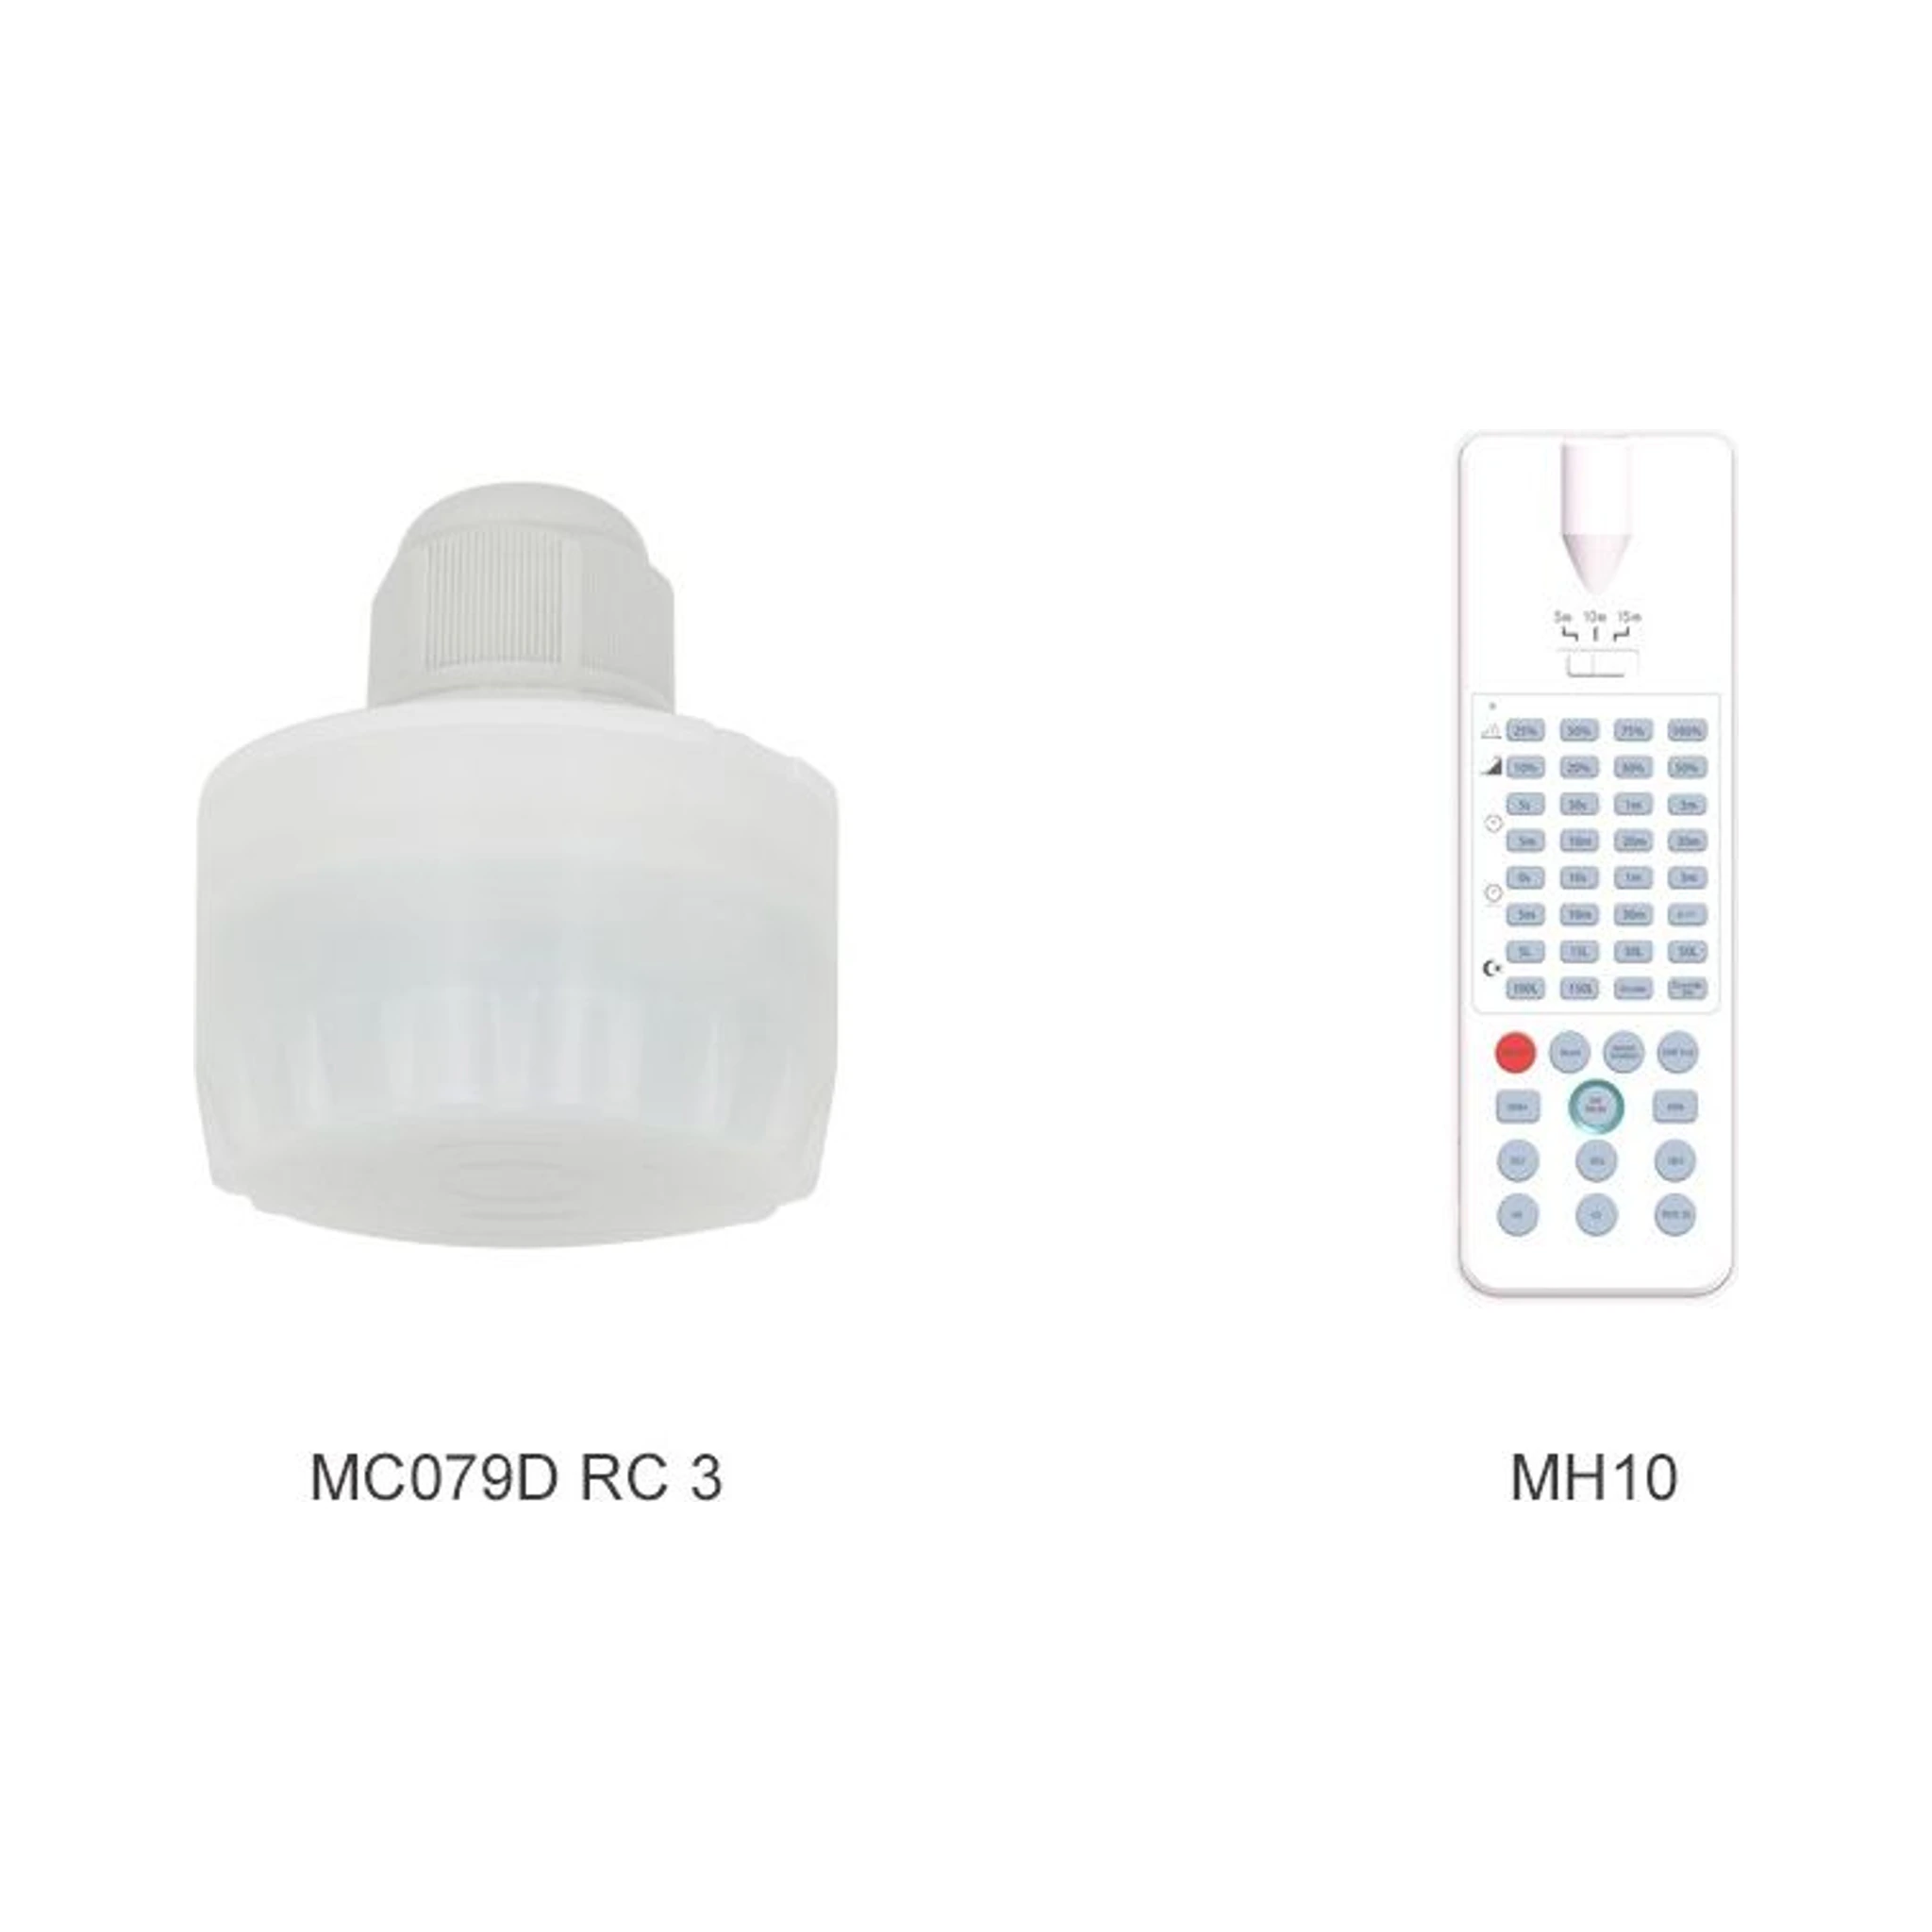 Luminaire Control SensorsMC079D RC3View full product parameters
- Rated voltage
- 12V DC +/-1V
- Stand-by power
- <0.3W
- Working mode
- 0-10V DC dimming
- Operating frequency
- 5.8G Hz +/-75MHz, ISM band
- Transmit power
- 1mW maximum
- Hold time
- 5s / 30s / 1 / 3 / 5 / 10 / 20 / 30min
- Detection area
- 25% / 50% / 75% / 100%
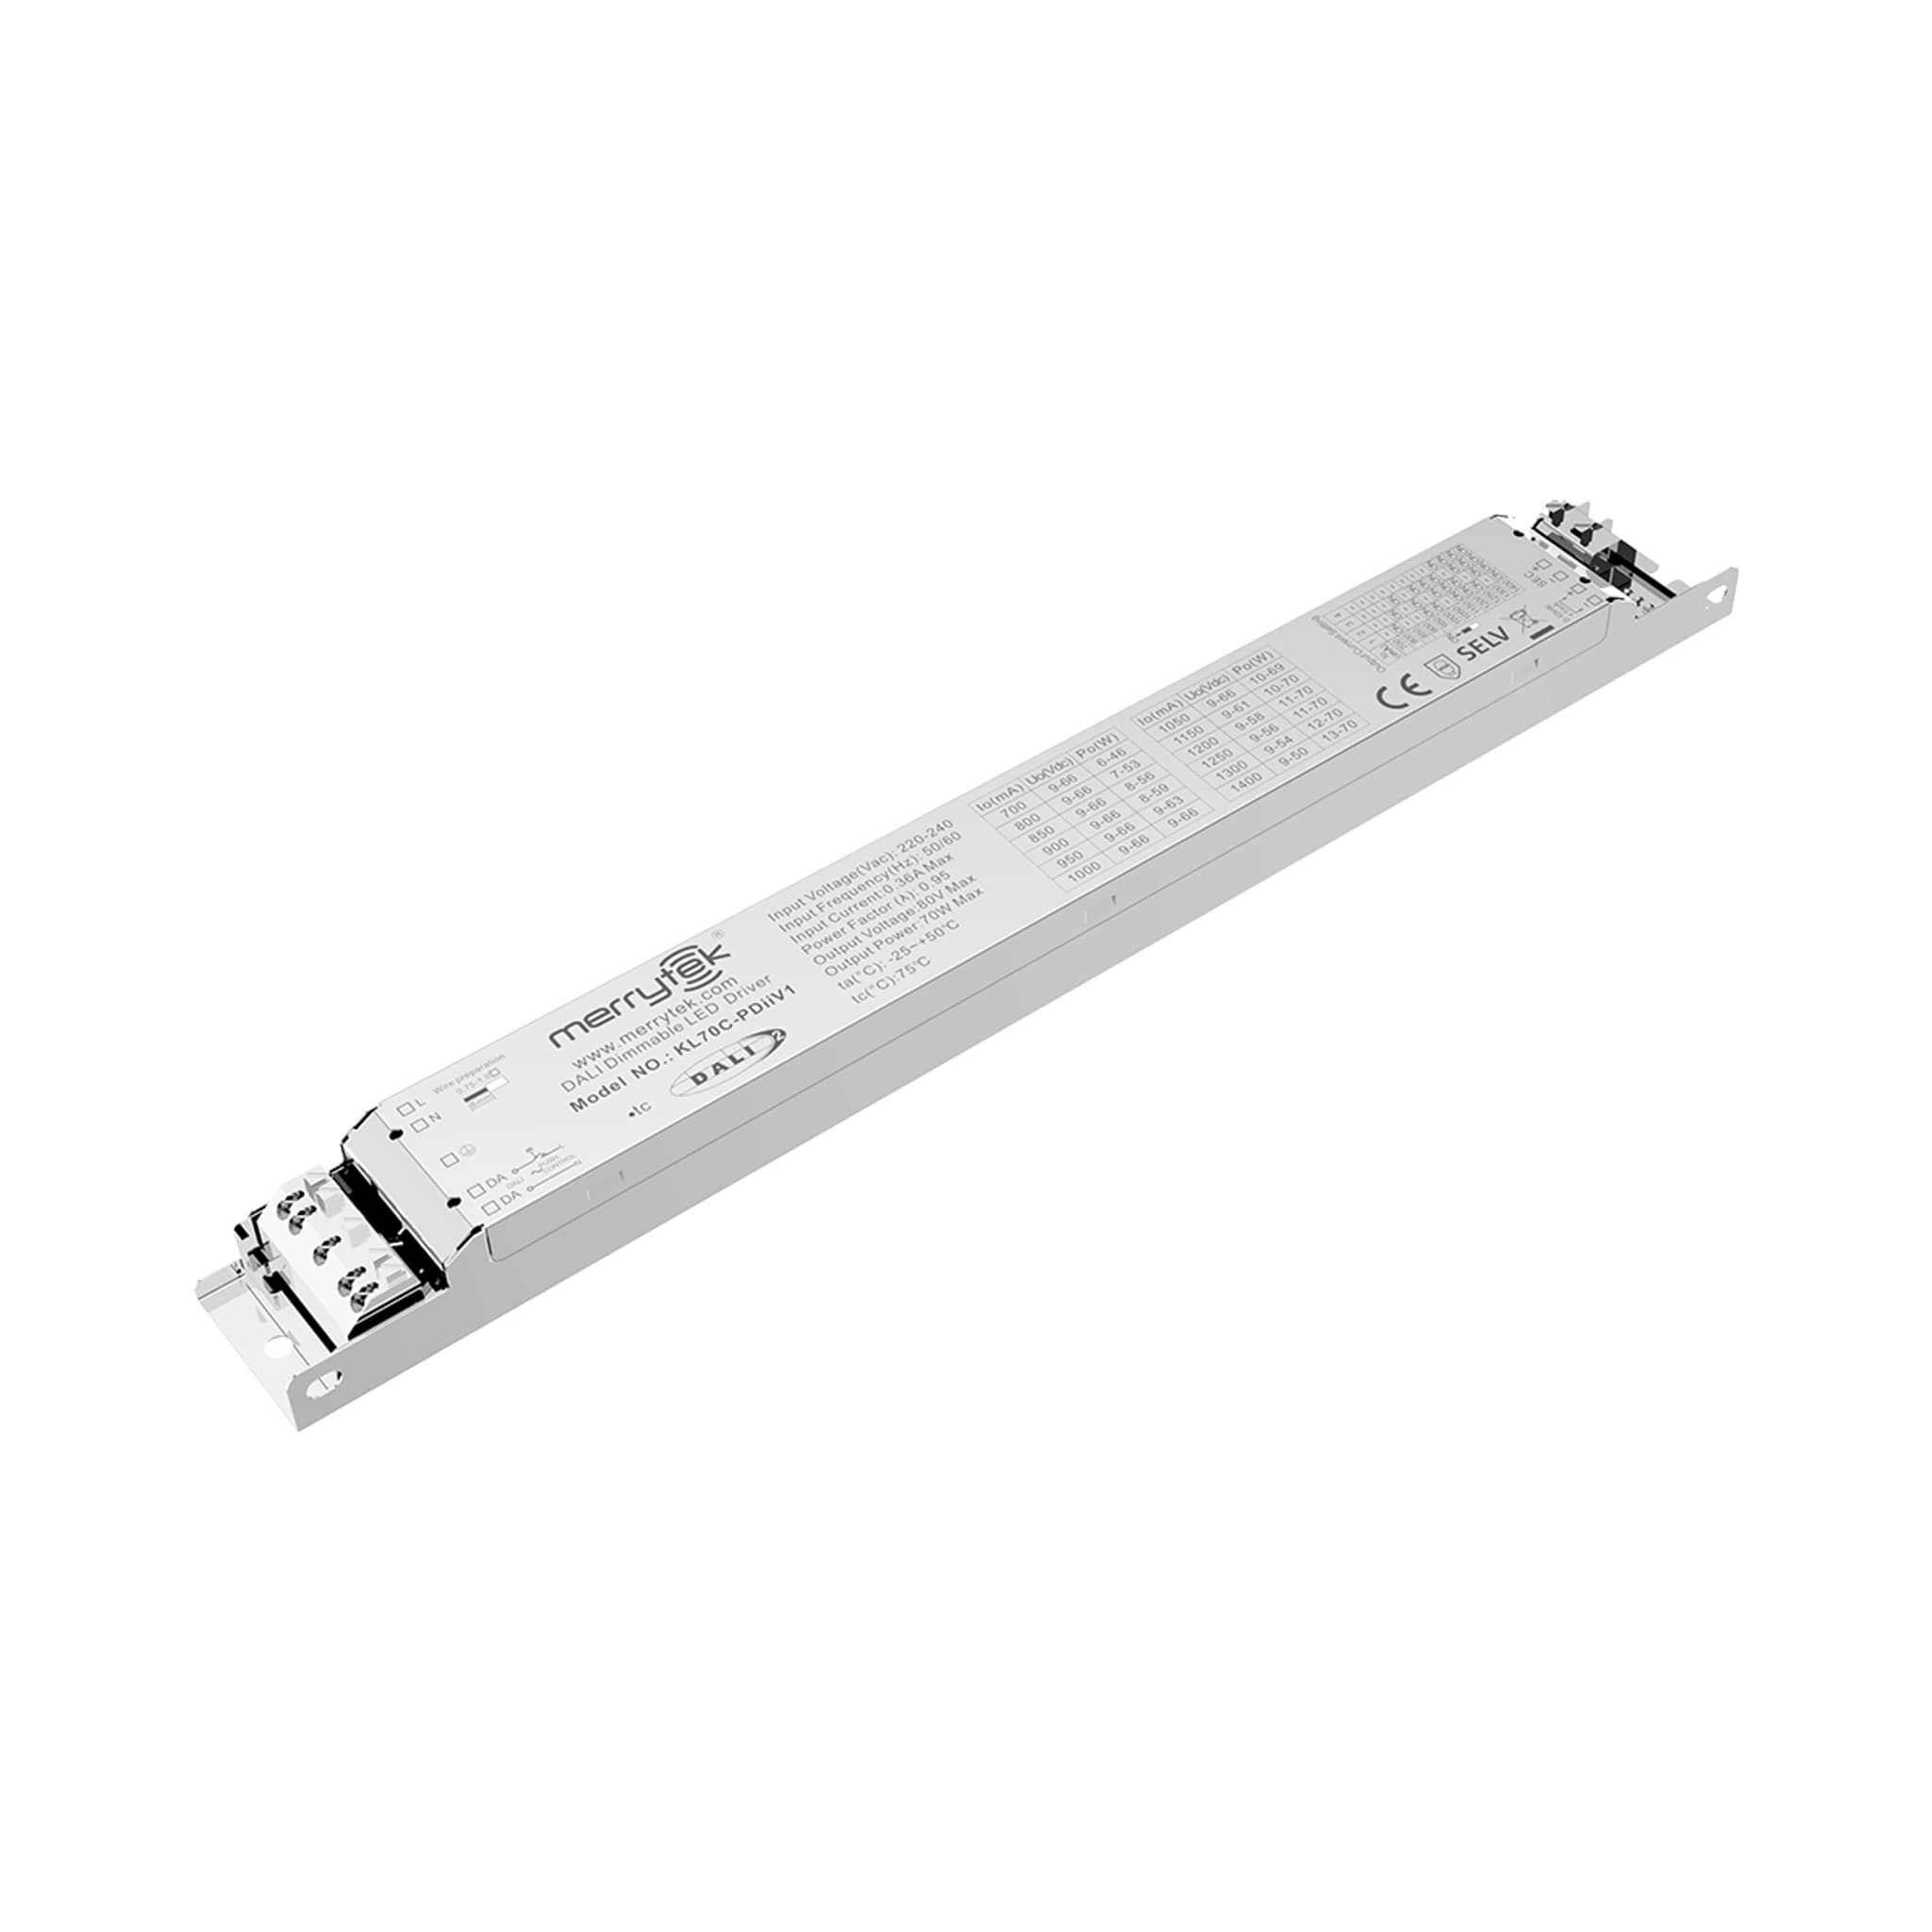 Smart DriversKL70C-PDiiV1View full product parameters
- Dimming interface
- Primary PUSH, secondary 1-10V, primary PWM, DALI
- Dimming range
- 2%-100%
- Input voltage
- 220-240Vac, 50Hz /60Hz
- Standby power consumption
- <0.5W
- Work efficiency
- 87% Max. @230Vac
- Output current/voltage/power
- 700mA / 9-66Vdc / 46.2W 800mA / 9-66Vdc / 52.8W850mA / 9-66Vdc / 56.1W 900mA / 9-66Vdc / 59.4W950mA / 9-66Vdc / 62.1W 1000mA / 9-66Vdc / 66W1050mA / 9-66Vdc / 69.3W 1150mA / 9-61Vdc / 70W1200mA / 9-58Vdc / 70W 1250mA / 9-56Vdc / 70W1300mA / 9-54Vdc / 70W 1400mA / 9-50Vdc / 70W
- Safety Standard
- EN61347-1, EN61347-2-13
References and editorial note
Sources were reviewed on 2026-09-07. Recent industry sources and basic technical references are listed separately. The article is original engineering commentary grounded in the current product record, not a translation of the cited source. Any calculation or recommendation does not represent completed product interoperability testing.